The VO2 Max Test.
More than a number.

One session on a bike or treadmill that tells you more about your body than years of training guesswork.

Your VO2 Report
Cardio
  • Mets at VO2 Max
  • Heart Rate Response
  • VO2 Pulse
  • HR Recovery
  • Peak Effort
Respiratory
  • Peak Volume
  • Breathing by Zone
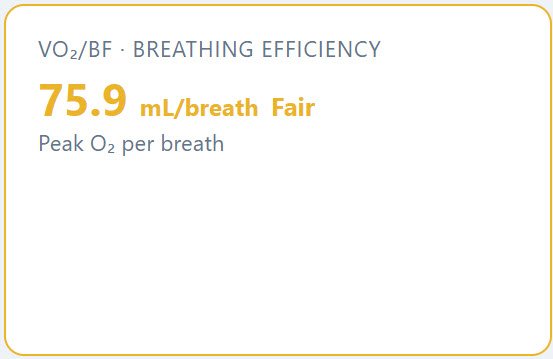
  • Oxygen per Breath
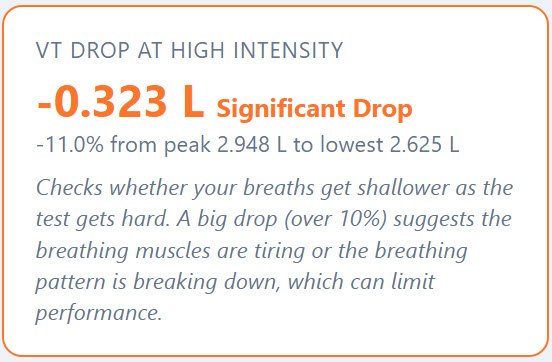
  • Volume Drop at High Intensity
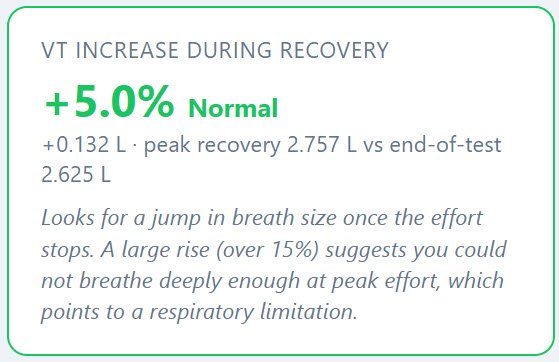
  • Volume Increase Post Test
Metabolic
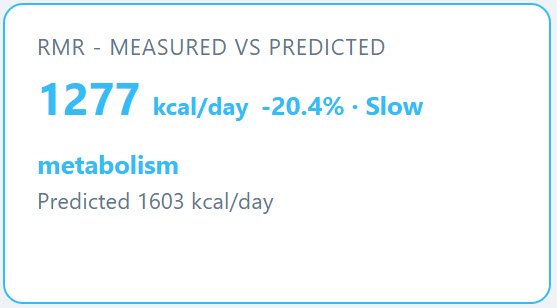
  • Resting Calorie Number
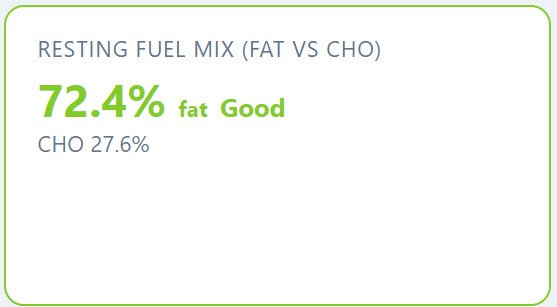
  • Fat v Carbs
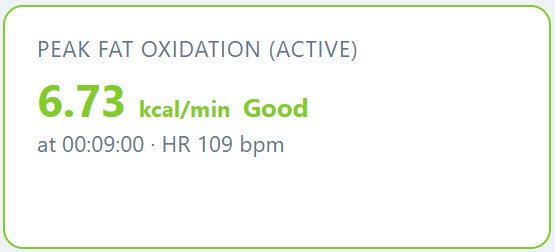
  • Peak Fat
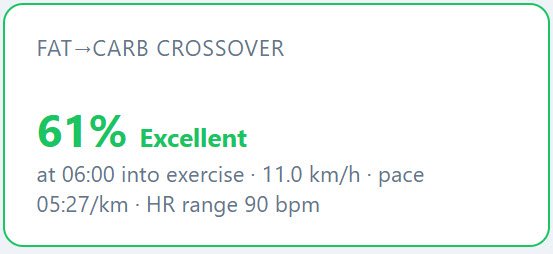
  • Crossover Point
  • CO2 Clearance

Every number, measured.

A sample of what lands in your enhanced report. Everything measured on the day, not estimated from a formula.

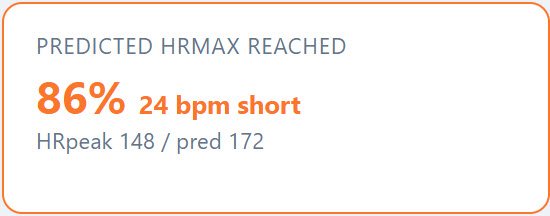
  • Predicted HR Max
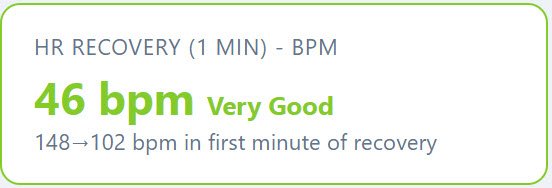
  • Heart rate recovery
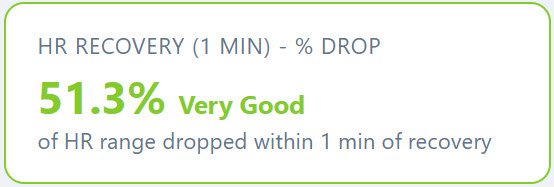
  • Heart rate recovery, percentage drop
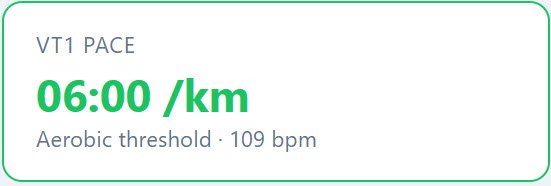
  • VT1 pace
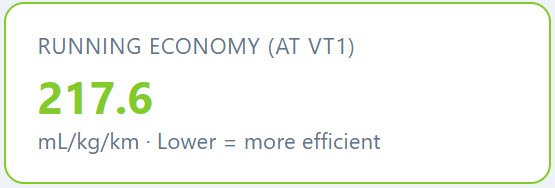
  • VT1 economy
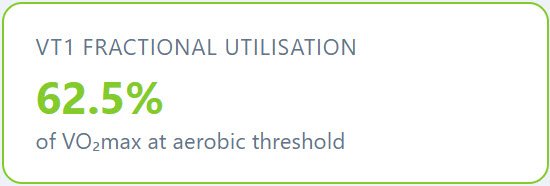
  • VT1 pace utilisation
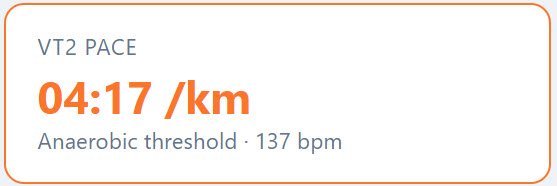
  • VT2 pace
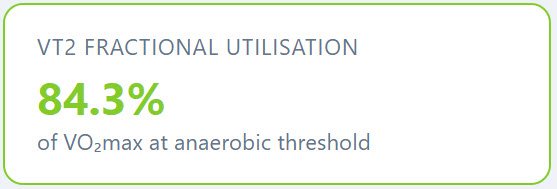
  • VT2 pace utilisation
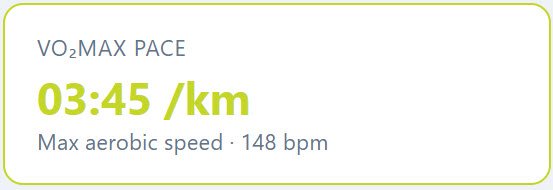
  • VO2 pace
  • Peak fat
  • Fat and carbohydrate crossover point
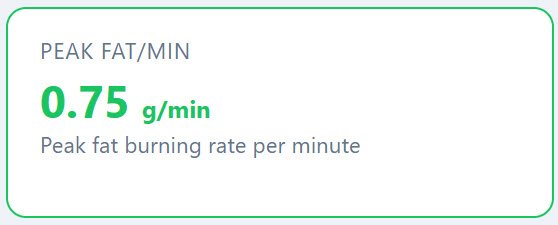
  • Peak fat per minute
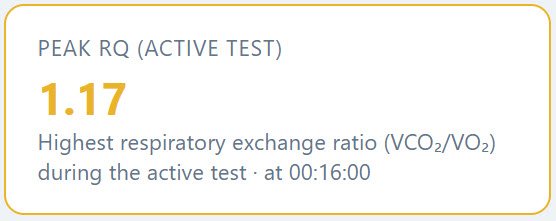
  • Peak RER during the test
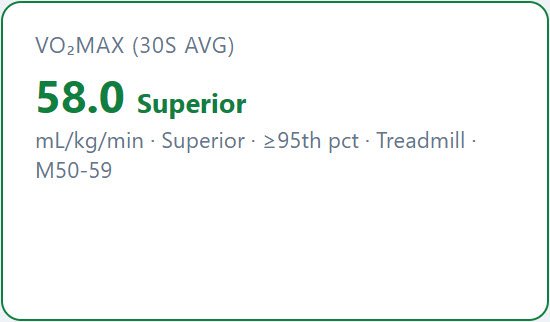
  • VO2 max
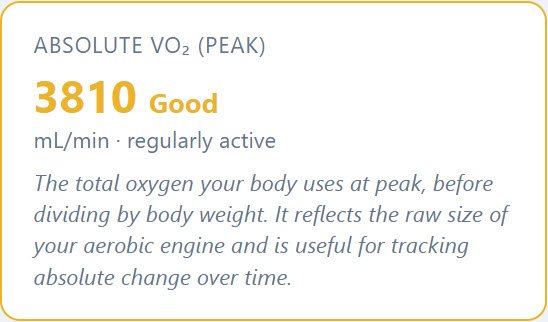
  • Absolute VO2
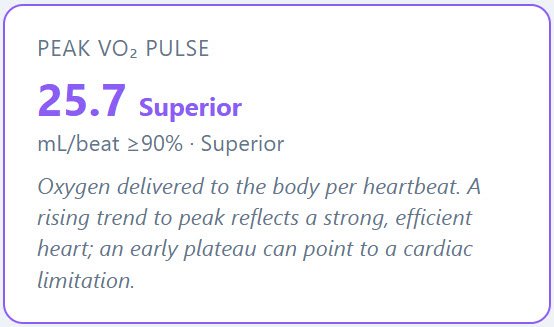
  • Peak VO2 pulse
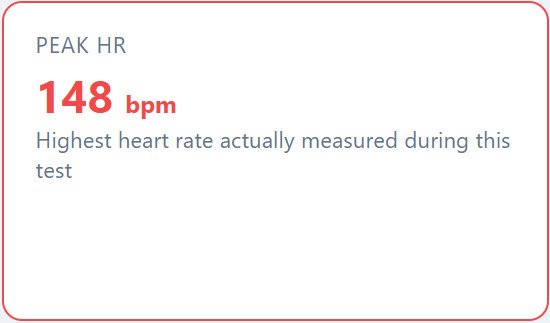
  • Peak heart rate
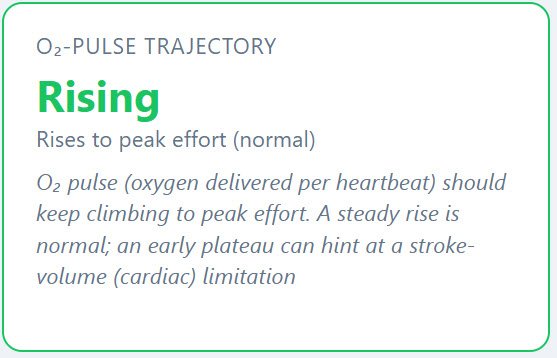
  • O2 pulse trajectory
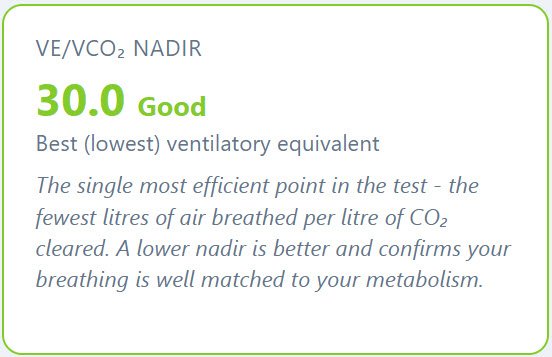
  • VE/VCO2 nadir
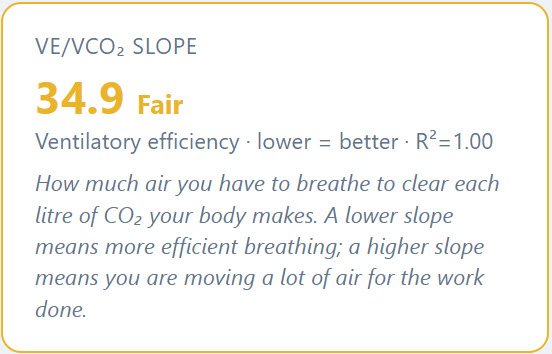
  • VE/VCO2 slope
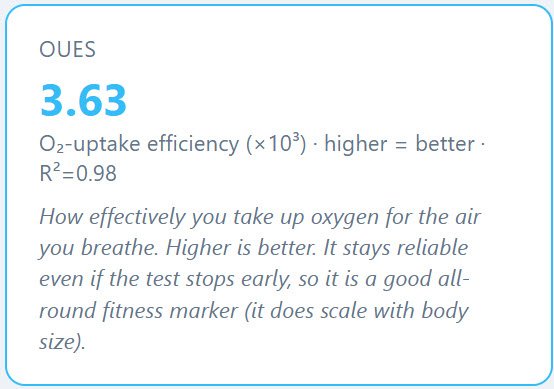
  • OUES
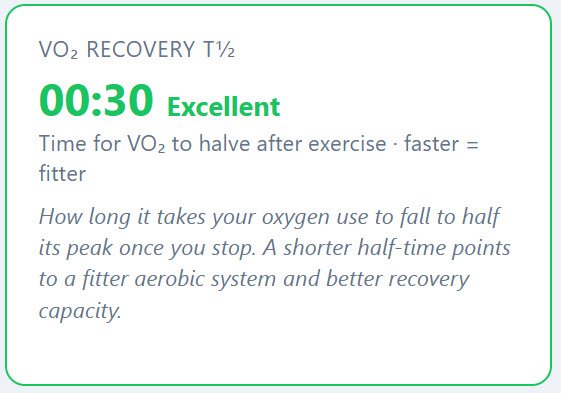
  • Recovery
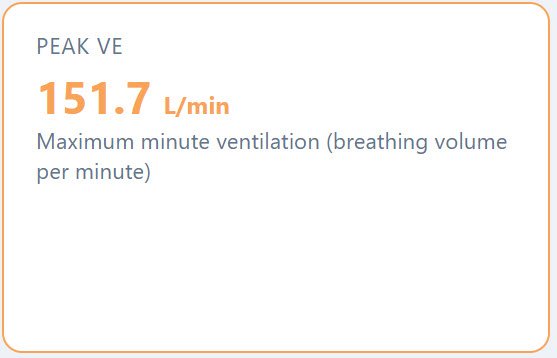
  • Peak volume per minute
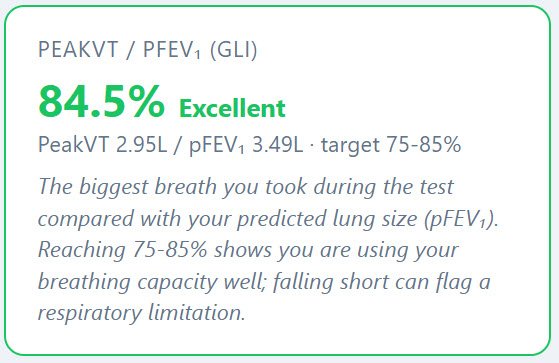
  • Peak volume versus predicted
  • Breathing efficiency
  • Drop in volume at high intensity
  • Volume increase during recovery
  • Resting calories
  • Fat versus carbohydrates at rest
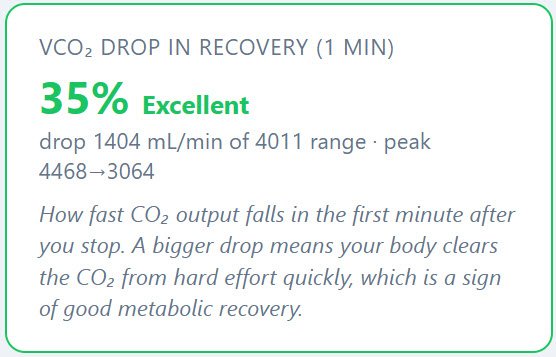
  • CO2 drop in recovery
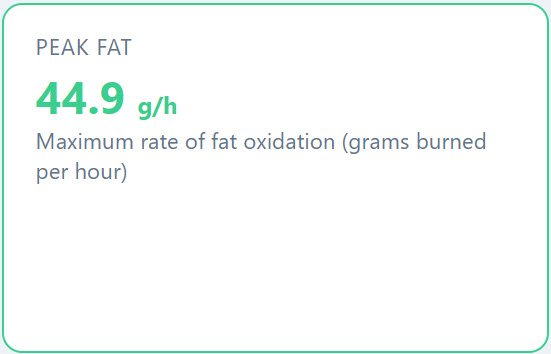
  • Peak fat per hour

See the test in action

“This is exactly what a session looks like. You can see how the data builds up in real time and why the number at the end is just the beginning of what we learn.”

Here's what happens during the test

You’ll run or ride at progressively harder efforts while wearing a mask that measures exactly what your body is doing. How much O2 (Oxygen) you’re taking in, how much CO2 (Carbon Dioxide) you’re producing, how your heart rate responds and where your fat to carb crossover point is. I track this across every step of the test. The result is a picture of your physiology that no watch or fitness tracker can give you.
Standard Report

Every VO2 Max test includes this as standard. It’s already more detailed than most people have ever had.

  1. Page 1

  2. Page 2

  3. Page 3

  4. Page 4

  5. Page 5

  6. Page 6

  7. Page 7

  8. Page 8

1 / 8

Want the full picture?
The enhanced report goes further.

I built the enhanced report for people who want to understand their physiology properly – not just the headline numbers, but what’s actually driving them. 

Cardio Metrics

Respiratory Metrics

Metabolic Metrics

The enhanced report can be delivered on its own or as part of an 8 week improvement plan.

  1. Page 1

  2. Page 2

  3. Page 3

  4. Page 4

  5. Page 5

  6. Page 6

  7. Page 7

  8. Page 8

  9. Page 9

1 / 9

The charts behind the numbers

Every marker is plotted across the whole test, not reduced to a single figure. Tap any chart to enlarge it.

  1. VO2 max

  2. VO2 pulse

  3. O2 pulse trajectory

  4. VT1 & VT2 thresholds

  5. Zone builder

  6. Heart rate trendline

  7. Hitting heart rate max

  8. Heart rate recovery

  9. VO2 recovery

  10. VE/VCO2 slope

  11. OUES

  12. Peak volume v predicted

  13. Oxygen per breath

  14. Volume drop at high intensity

  15. Volume increase in recovery

  16. CO2 drop in recovery

  17. Peak fat

  18. Fat v carbs crossover

1 / 18

After the test, you'll know

Exactly what to work on

Not a list of everything, just the one biggest win.

Your true zones

Not generic percentages. Your actual thresholds.

How your body fuels itself

Fat and carb usage at every pace. and heart rate

A dedicated 8 week plan

Sessions for improvement mapped out for you.

Ready to find out what’s holding you back?

Or get in touch if you want to chat through what’s right for you.